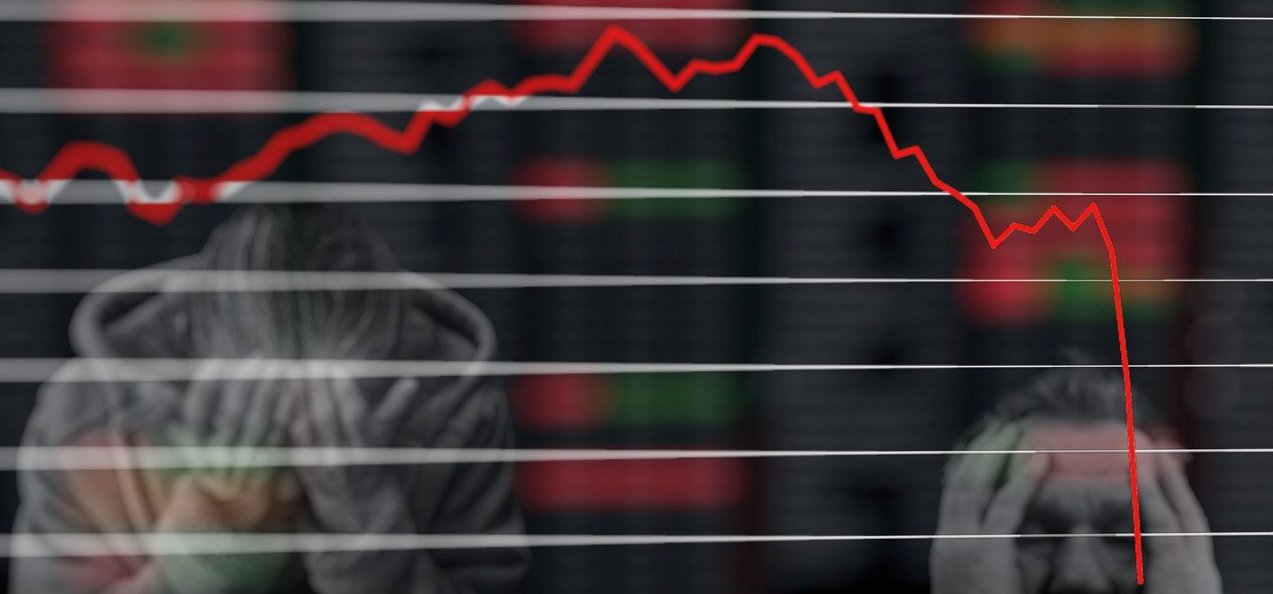
Half a year after the U.S. job market began to crater from the COVID-19 pandemic and ensuing lockdowns, the recovery is far from complete. The key takeaways from my deep dive:
Despite record monthly job growth this spring and summer, we have recovered only half of the lost jobs lost during the frenetic initial weeks of the pandemic.
The jobs recovery is stalling as “temporary” furloughs convert into permanent job losses, hiring slows, new claims for unemployment remains stubbornly high, and more layoffs loom.
Unlike recent economic downturns, this pandemic recession is hurting women more than men, with relatively more women suffering job losses or otherwise exiting the labor force.
Together the gathering headwinds suggest that the recovery will slow further or even reverse absent another round of robust stimulus. Accordingly, a full jobs recovery will take at least until early 2022 and likely longer.
The COVID-19 Recession is unprecedented in so many ways: the ferocity and speed of the downturn, the strength of the initial recovery, the disruptions to our normal lives. To these overall impacts, add the greater impacts on women, the opposite of the typical pattern in a recession. Relatively more women have lost their jobs because this recession, unusually, has hit services jobs harder than good-producing jobs. And more women are dropping out of the labor force altogether to care for their children as schools and day-care remain shuttered in much of the country.
It has become abundantly clear that our nation cannot fully heal, and the economy cannot get back to pre-pandemic levels, until it is safe for people to work, shop, socialize, and recreate as they did before. Much of the nation’s productive capacity will remain idle or underutilized until we have effective COVID-19 treatments and/or vaccines.
Even if the extraordinary August job gains were maintained going forward—which would be highly improbable given the slowing job growth and gathering headwinds I discussed here—we wouldn’t regain all the lost jobs until early 2022. Most likely, it will take considerably longer. In the meantime, women will bear a disproportionate share of the economic pain.
Retail sales climbed back to record levels in June and continued to grow in July and August—despite painful levels of unemployment and income loss. But the good times will not last much longer. The massive government income support programs that funded consumer spending are ending, while shoppers will need to resume normal household necessities like rent and health care.
Over 25 million Americans are out of work and collecting unemployment insurance. Millions more unemployed workers don’t even qualified for benefits. And millions of gig workers have experienced significant income declines. Yet retail sales in the U.S. are back to their highest levels ever—just months after the retail sectors endured its sharpest decline on record.
A closer look at the sales data reveals that all is not well at the nation’s shopping centers and along our main streets. The picture painted by the broad brush of total retail sales figures obscures the reality that the pandemic is cleaving the retail sector into distinct winners and losers as households make major profound shifts in what, how, and where they buy. More people are buying a lot more online than ever before—not just more stuff overall but more types of goods (especially groceries and personal care items) and even services (like prepared food and cocktails).
Beyond new ways of shopping, more profound have been the wide-ranging changes in the composition of the household shopping basket. Confined to our homes, we’re spending more on eating at home and upgrading our houses and gardens, to the benefit of grocers (+9.4% this year) and home improvement stores (+9.8%). On the other hand, restaurants (-16.6%) have been devastated by government restrictions as well as consumer fears of contracting the virus.
Other clear losers in the pandemic economy have been department stores (-14.8%) and especially apparel stores (-21.2%). Both have been crushed by the fall in socializing and entertainment options, as well as the shift to working from home. With fewer opportunities to dress up. we just don’t need as many new clothes or accessories. And with so many people out of work, mid-priced retailers also have been hurt by consumers’ need to economize, to the benefit of discount stores (+4.1%), such as warehouse clubs, superstores, and dollar stores.
A Rebound Less than it Seems
Regardless of the distribution of retail sales across different sales categories and channels, the paradox remains: How can total retail spending be back up to record levels exceeding pre-pandemic volumes when so many households are obviously still struggling financially?
I offer three factors. Far and away, the most important reason is the unprecedented level of income support from the federal government. Collectively the Bureau of Economic Analysis (BEA) reports that COVID-related programs accounted for 15% of all personal income in April and still amounted to 8% in July. And unemployment insurance, which pre-COVID typically accounted for 0.2% of personal income, soared to 7% in June. Add it up and the combination of COVID-related federal and state government programs accounted for an astonishing 14% of all income in July, though this support fell by almost half in August with the expiration of some COVID programs.
Second, and directly related, CARES didn’t just stabilize aggregate income in the country but actually raised incomes for most Americans. One study estimates that two-thirds of unemployed workers eligible for unemployment benefits were able to receive payments exceeding their lost earnings, with a median compensation 34% greater than their prior wage income. And millions more low- and moderate-income households got a meaningful one-time income boost through the EIP payouts.
Flush with this cash, even out-of-work Americans were able to afford groceries and other necessities. But they didn’t spend all of their extra income. In fact, most people either saved most of their stimulus payments or used them to pay down debt. With the income saved, many households have been able to maintain their spending even once their unemployment benefits and other CARES income expired.
The final reason consumers could maintain their spending on retail goods and services is by cutting back on other spending elsewhere. Retail sales account for less than half of all consumer spending What else do consumers buy that are not considered retail sales? Housing, utilities, education, most health care expenses, travel, and most forms of entertainment, to name some of the biggest items.
And households have been cutting back on all sorts of non-retail expenses. Due to eviction moratorium for qualifying renters and mortgage forbearance protection for homeowners, many unemployed workers have reduced their housing costs, at least for a while. Despite the pandemic, spending on health care is down because medical providers have sharply reduced discretionary office visits and hospital procedures. Fewer students are attending college and paying tuition. And of course, travel spending is way, way down.
In sum, I estimate based on BEA figures that total non-retail consumer spending is down 7% this year, while retail sales over the same period were up over 1% (Fig. 5). Thus, households could afford to keep spending on retail goods and services—whether online or at the mall—only by cutting spending elsewhere.
A Sustainable Recovery? Not Likely.
Absent another major federal stimulus package, retail sales growth will reverse course this autumn.
First, the pandemic income support programs are largely gone, and six months after the CARES Act was signed into law, Congress evinces little likelihood of extending, expanding, or replacing the measure. And more job cuts are coming, The end of pandemic income support and the coming wave of additional layoffs will sharply cut consumer income, thereby reducing all types of consumer spending.
The accumulated savings that households have socked away will help sustain spending for a while but won’t last long. As consumers begin to tap into their savings, they inevitably cut back their spending further until their employment prospects improve.
Finally, retail sales will fall because households won’t be able to defer their non-retail spending indefinitely. Eventually, the missed housing payments must be repaid. Eventually, people will begin to incur more medical expenses.
Taken together, it seems certain that—again, absent additional government interventions—retail sales will soon fall again and remain depressed until the pandemic eases and the economy recovers. And for that we need wide adoption of a safe, effective vaccine. I’m waiting.
The American economy is incredibly dynamic – even in a soul-crushing pandemic. Lost in the disheartening news about the depressing number of firms going bust and workers losing their jobs is the other side of the ledger: new and existing firms are adding millions of new jobs. I estimate about three for every ten jobs lost through furloughs or lay-offs – or almost nine million new jobs in all – were created during the dark first six weeks of the pandemic.
This process of simultaneous job creation and destruction is a vital, if underappreciated, feature of our economy, and will be an important force in our recovery from the pandemic recession. Still, the overall labor market picture is grim and unlikely to be fully reversed soon.
Over 21 million Americans lost their jobs in March and April, the first two months this nascent recession, equal to 14.5% of all jobs, according to the Bureau of Labor Statistics (BLS); less than half of these jobs have been recovered in the three months since at the economy began to reopen (May through July). The astonishing 20.8 million jobs lost in April alone was ten times the previous record monthly job loss. In only six weeks we lost virtually all the jobs created in the last decade (22.8 million) – almost times as many jobs as were lost in the entire Global Financial Crisis (GFC), which itself was the high-water mark for economic downturns since the Great Depression 90 years ago.
And yet, despite all this depressing news, there is cause for some optimism. For one thing, the vast majority of workers who lost their jobs were only temporarily “furloughed” or “completed temporary jobs” rather than permanently “laid-off”, which theoretically should simplify and expedite rehiring as government-mandated shutdowns are relaxed.
While there is considerable doubt about how much and how quickly ailing firms will be able to rehire their former employees, other firms are actually thriving, even surging. Most obviously, e-commerce is booming at the expense of physical retailers, while groceries are flourishing as restaurants languish.To cite some noteworthy announcements: Walmart plans to hire 50,000 more workers, on top of the 150,000 they just hired to deal with increased demand, while Amazon is adding another 75,000 new workers to the 100,000 previously announced. That’s 375,000 new jobs from just two firms.
Add to that 100,000+ new hires at grocers like Safeway. Kroger, and Albertsons; drug chains like CVS (50,000 new jobs), Walgreens, and RiteAid; and home improvement stores like Lowe’s (30,000) and Home Depot. The food delivery startups (DoorDash, Uber Eats) are also adding workers, as are pizza chains and dollar stores. Even the fledgling legal cannabis industry is seeing a hiring boom. All this despite the net loss of almost two million retail jobs overall over the past two months, equal to 14% of all retail jobs.
But job creation is hardly limited to just the retail sector. Jobs are growing across many sectors for firms that make products or provide services that help us either deal with the health crisis or otherwise adjust to the “new normal.” Of the former, it’s all hands-on deck, and many new hands, for pharmaceutical companies seeking COVID-19 vaccines or treatments and manufacturers of masks and hand sanitizers. Cleaning services are seeing a surge in demand, as are delivery services. Thus, the economy continues to create many new jobs, as well as new firms, even as many more are destroyed or at least waylaid.
A Very Dynamic Economy
This process of simultaneous job creation and destruction is not unique to this pandemic. Only the scale is unprecedented. When we hear that 200,000 jobs are added in a monthly jobs report – the average over the past decade of economic expansion – we implicitly focus on only these net new jobs created. But the reality is much more dynamic, with a vastly greater number of jobs begun and ended each month, as shown in the following graph, which goes back to 1999 when the government started tracking the flow of gross job gains and losses.
Which brings us to the current recession. The media reports of hiring at retail and delivery firms illustrates that the economy is still adding many jobs, even as we’re hemorrhaging jobs overall. So when we read that the country lost over 22 million jobs during March and April, we now understand that’s net jobs lost. But how may gross jobs were lost and, more importantly, how many were created?
Some 30.8 million people filed new claims for unemployment benefits in March and April. With 22.2 million net jobs lost over those two months, that implies the economy added about 8.7 million new jobs over the same period. In other words, the economy gained almost three new jobs for every ten it lost (8.7M versus 30.8M). This finding almost precisely matches the findings from a Federal Reserve Bank of Atlanta study by Dave Altig, John Robertson, and other Atlanta Fed economists and researchers, which concluded that “COVID-19 caused 3 New Hires for Every 10 Layoffs.” And it’s broadly consistent with another Fed report that found that 4% of U.S. adults surveyed they started a new job in March compared to 13% that lost their job during the month (again, a 3 to 10 ratio).
Conclusions and Implications
With all the ugly economic headlines in the first two months of the pandemic, it is perhaps comforting to learn that upwards of nine million jobs were created over this period, even as three times as many positions were lost. Likely more than a million of these new jobs were created in either new firms or the new branches of existing firms. Capitalist economies are endlessly adaptable, as firms and workers continuously seek new to identify and capture changing market opportunities, even during harsh economic conditions.
This dynamism gives hope that our economy will continue to evolve and create new opportunities for enterprising workers and investors as we collectively confront the many challenges of containing and ultimately conquering COVID-19.
Still, the cold, hard reality is that some 13 million fewer Americans hold jobs now than just prior to the pandemic. Many more gig and part-time workers are working fewer hours for less income.
And given the continued rise in coronavirus cases across the country, and ominous warnings from epidemiologists and public health professionals of a potential major infections wave in the fall, it seems inevitable that some of the recent progress we’ve made in restarting the economy and rehiring workers will be reversed – particularly with the expiration of the various federal business and household income support programs.
Restoring our pre-pandemic prosperity – imperfect as it was – will be a long, tough haul.
The Census Bureau reported almost shocking economic news last week: retail sales now exceed pre-pandemic levels. Retail sales including restaurants amounted to a record $536 billion on a seasonally-adjusted basis, up 1.2% over January. This volume is a remarkable achievement, especially considering that unemployment still exceeds 10% – down from its pandemic peak, but still above the high-water mark in the Great Financial Crisis (GFC). For comparison, retail sales took 2½ years to return to their pre-recession peak after the GFC, and here we are back at another peak after just six months.
Welcome news for the beleaguered retail sector? Definitely, but not quite as positive as landlords, tenants, and investors would hope. A closer look at the data reveals that bricks and mortar retailers have not yet fully recovered, particularly at the mall. Much of the gains have gone to “nonstore retailers,” predominantly e-commerce.
To be sure, shopping center and mall sales have been trending up in recent months as more of the economy has reopened. Mall sales, especially, have grown since their trough in April. But overall, in-store retail sales have not kept pace with total retail sales as more shopping has shifted online. And more spending has swung from discretionary items typically found in malls to more essential items sold in grocery stores, pharmacies, and home improvement stores.
But the far bigger challenge for shopping centers and malls is that this level of retail spending is likely not sustainable, propped up by enormous – but temporary — government income support. In the face of a widening pandemic and massive economic disruptions leading to a deep recession, the federal government stepped in to replace or supplement income on a scale far exceeding that in prior recessions.
However, these programs have all now expired, which will trigger another round of layoffs and reduce consumer spending. It now seems certain that – absent additional government interventions — retail sales will fall again in August and remain depressed until the pandemic eases and the economy recovers.
Thus, the recovery in retail sales reported last week is clearly positive news, but retailers and shopping center owners should not be deceived into believing that the crisis has passed. More challenges are sure to emerge in the coming weeks.
The preliminary estimate of second-quarter headline GDP released today was ugly if not unexpected: the 9.5% plunge over the prior quarter translates to a 32.9% annualized decline, more than three times the greatest prior quarterly fall since the government started tracking GDP in 1947. The modicum of good news is that economic output apparently bottomed out in April and rebounded somewhat in May and June, though the most recent data suggests the recovery is now stalling.
But almost as unusual as the magnitude of the overall decline are the trends in the underlying GDP components. A typical recession hits businesses harder than consumers, and consumer spending on goods harder than spending on services, as happened in the Great Financial Crisis (measured from the peak GDP in 2Q08 through its trough in 2Q09).
So far in this recession, however, business spending (-9.2%) has been more resilient than consumer spending (-11.7%) – not surprising given the massive unemployment and plummeting consumer confidence. Even more unusually, spending on goods (-2.9%) is holding up better than spending on services (-15.5%). The reason is obvious: Many goods retailers (which includes grocers and pharmacies) have remained open throughout the pandemic, while services from restaurants to salons, and sports arenas to concert halls, were largely shuttered – some to this day. Unfortunately, services account for a growing share of GDP, magnifying the economic impact of this downturn, with no realistic end in sight.
The employment news is bad enough without reporters and pundits exaggerating the grim trends. Almost 39 million initial claims for unemployment have been filed since mid-March when the COVID-19 pandemic really started taking hold of the economy. It is probably fair to conclude that “Nearly 39 million have lost jobs in US since virus took hold,” as the AP reported last week. In reality, a very small number of people might be doubled counted under some rare circumstances.
However, it is emphatically not true that “About 40 Million Americans Are Now Unemployed” as Forbes reported or that “US unemployment rises to 39 million” as the reported by the Christian Science Monitor, among many other publications. The difference? Even as (too) many Americans are losing their jobs and filing for unemployment, many other workers have been either rehired in their old jobs or have found new jobs. How many? It’s roughly the difference between “initial claims” for unemployment and “continuing claims.”
Official unemployment data does not nearly capture the pandemic’s full devastating impact of the on the labor market. Nonetheless, if we’re interested in counting the number of Americans who lost jobs due to the pandemic and remain out of work, the figure we should focus on is continuing claims, not cumulative initial claims. The 39 million initial claims figure, widely conflated in the press as joblessness, is 56% greater than the 23 million people who lost their jobs in the pandemic and remain unemployed according to the continuing claims data. In all, some 13 million Americans who initially filed for unemployment in the last two months have already been called back to work or found new jobs.
Key takeaway: Energy-sector states tend to save more for leaner times. This prudence is admirable given the historical volatility of energy prices – and the public revenues that depend on them.
Two recent articles caught my attention because they had similar-looking lists of U.S. states: First, an April 17 article in the Financial Times regarding vulnerability of state budgets to revenue shortfalls due to the COVID-19 recession. This was followed by an April 21 article in the Wall Street Journal concerning the impact of the fall in oil prices on state economies.
I was surprised to see that the states with the largest “rainy day funds” relative to their budget – that is, the states best positioned to survive revenue hits – are all states in which energy and/or mining contributes a significant share of state output. Indeed, as shown in the following charts, the seven top states ranked by the natural resource share of state economic output all rank among the states with the largest reserve funds relative to their budgets.
On average, energy and mining together account for 11.3% of economic output[*] in these seven states, and these states have an average 134 days of reserve.[†] By comparison, energy production and mining account for just 1% of national GDP, and the average reserve fund nationally is just 28 days, with many states having only minimal or no reserve funds.
This only makes sense, as the energy sector is the most volatile of all industries, with output, employment, and equity prices all unusually dependent on notoriously erratic commodity prices. To wit, the price of NYMEX dropped from over $60/barrel at the beginning of the year to just $20/barrel (3/18/20) in under four months – and then briefly plunged to -$37.63/barrel at the beginning of last week (4/20/20) before recovering to a hair under $17/barrel by the end of the week (4/24/20).
That’s volatile! Accordingly, prudence suggests that states highly dependent on this revenue source should save more for times – like now – when petroleum prices plunge, taking state revenues with them, and this is exactly what is observed: energy-dependent states tend to save more for leaner times relative to their budget.
Of course, a high ranking on this score could be the result of either a large denominator (saving a lot) or small numerator (restrained budgets) or both. In fact, my analysis shows that these energy states tend to spend more per capita ($8,000) than the national average ($6,000), though excluding Alaska, most rank near the middle of the pack, suggesting these energy states exercise fiscal prudence on both sides of the equation: near-average budgets per capita in good years while reserving funds for those inevitable periods of falling energy prices and revenues.
So it seems that saving for a rainy day – or a recession – takes a lot of energy (or other natural resources).
[*] My personal calculations differ somewhat from those published by the WSJ, but had no material impact on the rankings, so I have stayed with the WSJ figures for consistency with their exhibit.
[†] This average reserve figure is distorted by Wyoming’s whopping 397 days of reserve. However, the median days of reserve for these seven states, which reduces the impact of the Wyoming outlier, is still an impressive 90.1 days, almost double the 48-day national median.
The coronavirus has seized the global economy. With the number of
confirmed cases globally and in the U.S. growing by about one-third per
day – that is, doubling every three days – a broad range of economic
activity is rapidly shutting down, either by fiat or collapsing consumer
demand, dramatically compounding the supply chain disruption that began
last month. A near-term recession now seems to be a virtual certainty –
both globally and in the U.S. – if we’re not in one already. This is
all coming as the economy was slowing anyway, particularly in Europe.
The questions that remain are the unknowns at the onset of any
recession: how deep, how long, and how widespread? The most recent signs
are worrying indeed with cascading events that suggest that the
downturn may well precipitate a full-blown financial crisis.
But with the unprecedented pace of events and scale of governmental
responses to this pandemic, projecting economic conditions would be
folly: forecasting models are simply not designed to capture this
scenario. Much will depend on how widely and quickly COVID-19 spreads;
the success of governmental efforts to contain and address the
contagion; and the ability of central banks and governments to
counteract the economic devastation and bolster confidence.
Rather than offering precise forecasts that are rendered obsolete
almost as soon as they are written, the goal of this article is to
provide some perspective on how the economic shutdown (shutdown!) may
affect different segments of the commercial real estate sector, both
near-term and longer-term. Suffice it to say, with so much that is
uncertain and even unknowable at this point, the best course of action
for most market participants is to defer major decisions until there is
greater clarity as to market directions.
You may read the full article in the Real Estate Issues journal published by the Counselors of Real Estate here.
The January jobs report was surprisingly positive, with a significant jump in new hires, a slight bump in hourly wage growth, and continued rise people entering the labor force.Meanwhile, unemployment remains near its lowest level in five decades.
These trends are all positive for property markets and the broader economy.
Nonetheless, on deeper analysis, the trends are not nearly as positive as they seem on first blush: job openings are falling along with business sentiment, suggesting job growth will slow further this year. Despite the blip in January, the rate of job creation has been slowing for more than four years and remains well below trends from earlier in the economic cycle.
Wage growth remains below its 2019 average and earnings are flat due to falling hours worked.
While we can applaud the modest improvement in the job picture last month, it does not negate the weakening labor market overall. Based on these trends, we can expect CRE leasing to slow in 2020.
Real Gross Domestic Product (GDP) grew at an annualized rate of 2.1% in the fourth quarter of 2019 according to the first official estimate, broadly in line with consensus expectations (chart below on left). If that figure holds through subsequent estimates – and some adjustments are typical – GDP growth for all of 2019 would come in at just 2.3%, its slowest annual rate since 2016 and equal to the modest average for this economic cycle.
Among the key takeaways:
Despite the steady growth implied by recent quarterly GDP
figures, below the surface the US economy shows signs of weakening in key
sectors.
Growth was led by a sharp decline in imports, reflecting
weaker consumer spending as well as the bite from rising import tariffs. Consumption
and business investment both decelerated again in 4Q, with investment actually
declining for the third consecutive quarter.
The coronavirus pandemic has emerged as perhaps the biggest
downside risk for the global economy, though impacts will be focused on China while
hits to the US are likely to be minimal.
Expect GDP and job growth to slow further this year, though
the risks of recession appear to be receding.
In the property sector, market fundamentals should remain
strong overall, though transactions and appreciation will likely trend down.